Diversity Genie
Diversity Genie
Diversity Genie™ Introduction
Diversity Genie™ is a tool to
manipulate SD files. It allows to characterize molecular diversity of
large chemical datasets and it can help you to quickly and
easily make a decision whether a dataset is large and diverse enough to
pursue further with more sophisticated analysis. Diversity Genie™ has a powerful set of
functions to filter, sort and visualize chemical data sets, as well as compute
many molecular properties.
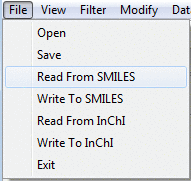
File menu
Diversity Genie™ can read and write SDF, SMILES,
and InChI files. Open and Save operate on SD files, while Read From/Write To SMILES and InChI
work with those formats correspondingly.
Set Temp Dir allows a user to set a folder for temporary files different from the system default (e.g. /tmp on Linux).The setting is only valid for the current session
and has no effect on OS X in the current version of Diversity Genie.
Toolbar
Toolbar buttons offer quick access to Open SD File, Save SD File and Stop Processing functionality.

Tabs
Diversity Genie™ has a multi-tab interface to
simultaneously work on several datasets or subsets of the same dataset. Note that while
it is possible to process multi-gigabyte files each open tab consumes a certain amount of memory
which may lead to resource exhaustion, especially in 32-bit versions of software which have a 2Gb limit on the total amount
of addressable memory. It is still possible to work with files larger than 2 Gb but we recommend keeping fewer tabs open in
such cases.
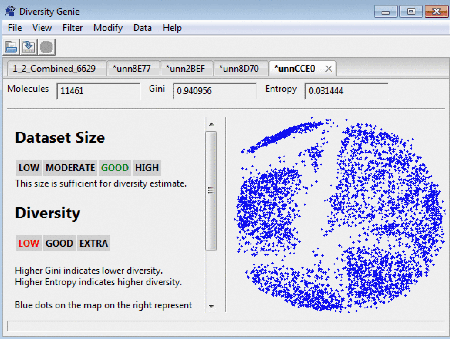
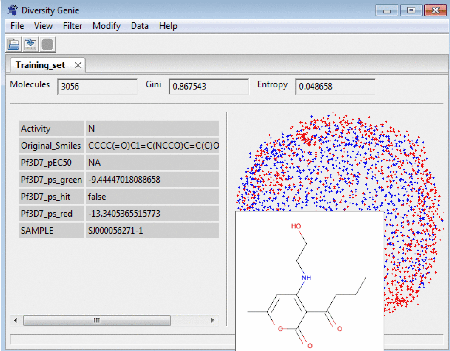
Diversity estimate
After uploading the dataset the number of molecules, the
values for Gini index and Entropy are shown. Note that the number of molecules processed may be lower than the
total number of records in the dataset. Most common problems include invalid valence values and incorrect connectivity
table. Lower Gini and Higher Entropy indicate higher diversity. Qualitative estimates for the dataset size and
chemical diversity are displayed in the left panel. The score is calculated for the whole set, not for an
individual pair of molecules and it is not based on any particular similarity measure
or distance metric.
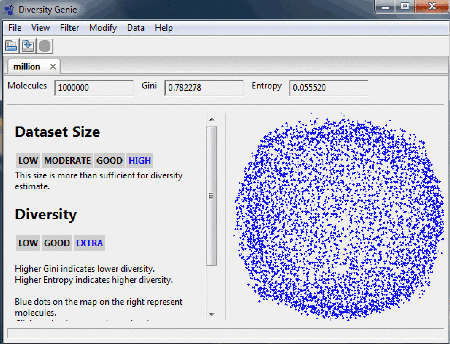
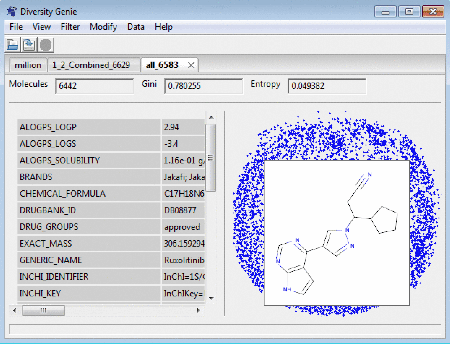
Molecular map
On the right panel of the window the user can see how
clustered/spread out the molecules (represented here as a blue dots) are. Clicking
on a dot brings up a tooltip with a picture of the
molecule under the mouse cursor. The molecular properties, if any exists, are displayed on the left side panel.
Dragging the mouse cursor allows the user to
"lasso" the molecules on the visualization map to extract them into a
separate subset.
View menu
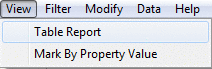
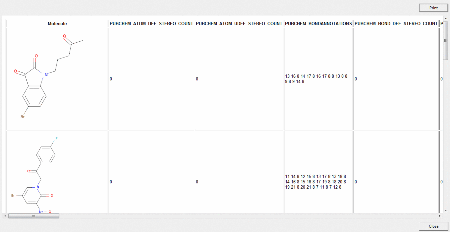
To quickly see images for a group of molecules and the corresponding property data from the dataset you can use Table Report. You can change the range 'From' and 'To' values but the total number of
molecules in this range can not exceed 200. It is possible to print the table report.
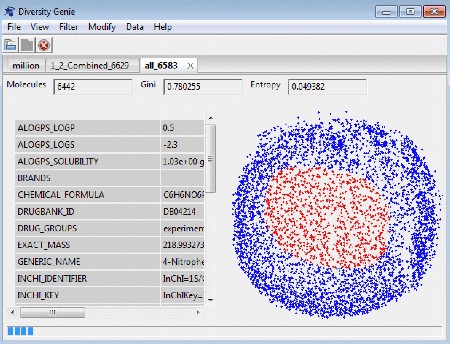
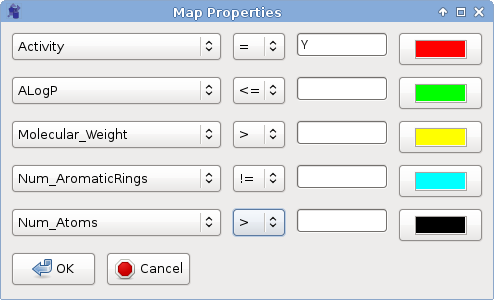
Mark by Property Value helps to visualize
the distribution of molecules with specific properties only.
You can use it, for example, to see the distribution of active molecules
vs. inactive, or molecules with molecular weight above or below
a certain threshold, or filtered by many other criteria.
You can select up to 5 properties to show and pick any color for each of the properties.Dots of specified color on the map on the right side of the window represent molecules with selected value of the property. Clicking anywhere within the map box will cancel the selection.
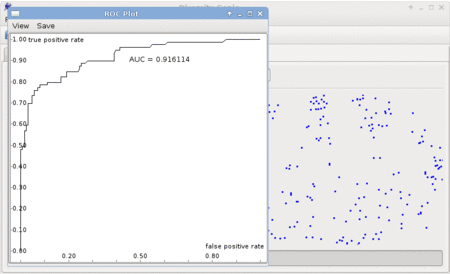
Graphing capabilities include making plots such as ROC Plot, Property Histogram, and Property vs. Property Plot. Area Under the Curve, the mean value, and Pearson correlation coefficient are automatically computed - the values can be shown or hidden by checking the box "Show auxilliary info". A screenshot of the plot can be saved by clicking "Save screenshot".
Filter menu
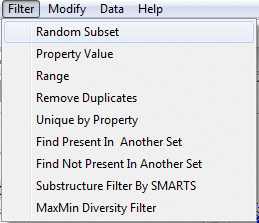
Filter menu allows for subset extraction from the current set of molecules.
The new subset of data is presented in a new tab.
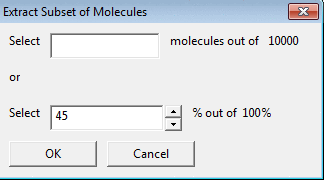
To extract a random subset of molecules from the original
dataset you can select the number of molecules or the percentage by using
Random Subset.
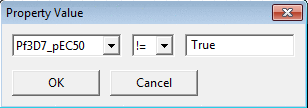
To filer the dataset by molecular property value select the property
(for example 'exact mass') and the condition for the value threshold (=, >,
<.., !=, >=, <=) by using Property Value.
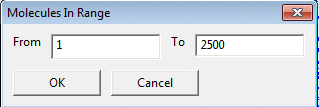
To extract a specific range of molecules
enter 'From' and 'To' values in the Range dialog.
You can remove duplicate molecules from the dataset by
using Remove duplicates. This method is using InChI keys for de-duplication.
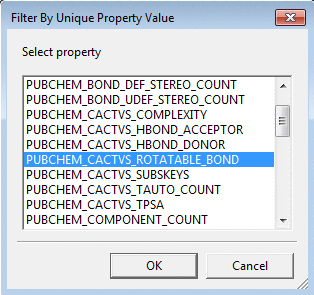
To filter by unique values of a molecular property
use Unique by Property and select the property name from
the pull down list.
To find molecules present both in the current dataset and another dataset
choose the second SD file by using Find Present in Another Set.
To keep only molecules from the current set which are not present
in another set use Find Not Present in Another Set.
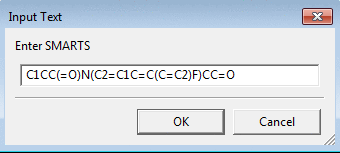
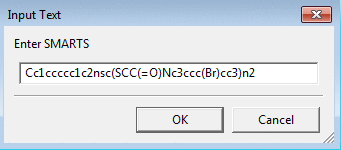
To filter a dataset by substructure or check how many of
the molecules contain the substructure use Substructure
Filter by SMARTS. The SMILES string for the substructure can
be used as it is also a valid SMART string. Some examples of SMARTS patterns
can be found at Daylight SMARTS web page.
MaxMin Diversity Filter implements maximum diversity subset extraction
as described in Ashton, M. et. al., Quant. Struct.-Act. Relat., 21 (2002), 598-604.
Note that it is a very computationally and memory intensive algorithm and for larger datasets we recommend
using random subset filter first.
Modify menu
To merge two or more datasets together you can append
additional SD files to the currently open dataset by using Append File.
A new tab will be opened. New set can be loaded from a file or from another opened tab.
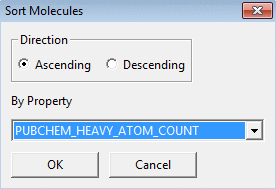
To sort very large molecular files by property values in ascending or
descending order use Sort. You will need to
choose the direction (Ascending or Descending) and property.
The data are sorted in the same tab window. While not the fastest method
the sort algorithm implemented in Diversity Genie™ allows for processing of files
larger than can fit into available memory.
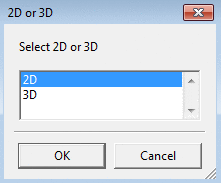
To calculate 2D or 3D coordinates use Add
Coordinates. Coordinates are added to the current dataset and
can be saved in SD format.
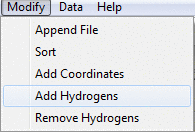
Add Hydrogens and Remove Hydrogens is used for adding
or removal of explicit hydrogen atoms to the molecules in the dataset.
Data menu
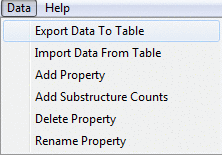
You can export property data into a tab-separated table file, which can
be later open in most popular spreadsheet programs, by using Export Data To Table
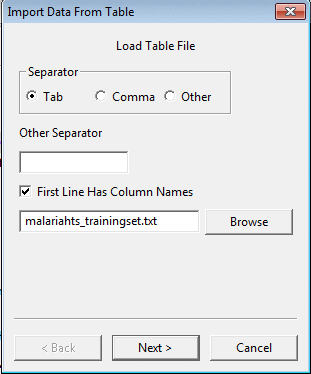
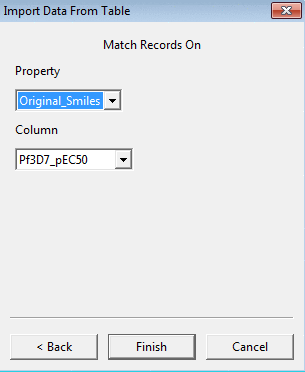
You can also merge data from a table file through Import Data From Table.
A wizard will open where you will need to select the field separator (comma, tab or something else),
whether or not the file has column names as the first line, the file name,
and on the second page the property name and the column which should be used as a key for merging the data.
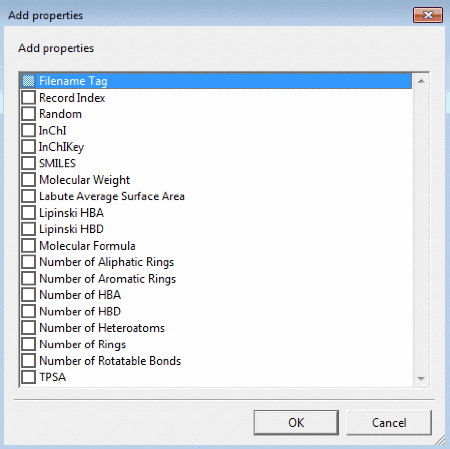
Add Properties can be used to calculate and add properties (Filename Tag, Record
Index, Random, InChI, InChIKey, SMILES, Molecular Weight, Labute Average
Surface Area, Lipinski HBA and HBD, Molecular Formula, Number of Aliphatic Rings,
Number or Aromatic Rings, Number of HBA, Number of HBD, Number of Heteroatoms,
Number of Rings, Number of Rotatable Bonds, TPSA).
Add Tag creates a new property with a given name and value, the same for all molecules of the set.
To count the number of times a substructure occurs in a
molecule and put this number in a property use Add
Substructure Counts. Some examples of SMARTS patterns
can be found at Daylight SMARTS web page.
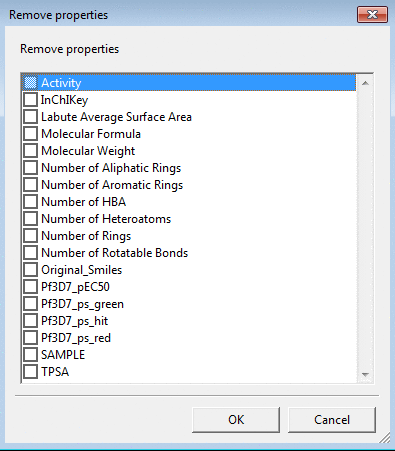
Delete Property can be used to remove one or several properties
selected from the pull down menu.
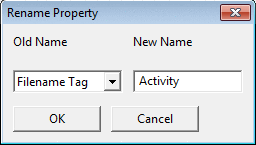
Rename Property changes the old name of the property
to a new one.
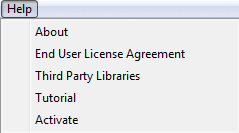
About dialog shows information about the software version, whether it is 32-bit or 64-bit binary,
and the url for the Diversity Genie™ website.
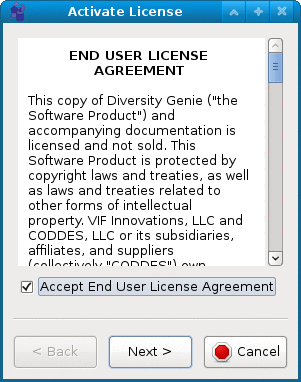
End User License Agreement allows you to read and print out the EULA for the software.
Third Party Libraries lists the libraries used by Diversity Genie™ and their respective license terms.
Tutorial is this text.
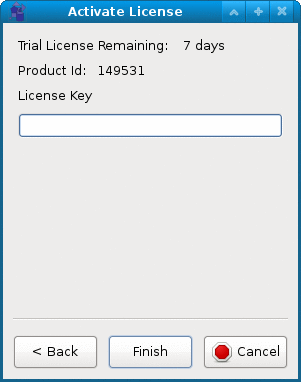
Activate can be used to activate the permanent license or to check the expiration of the free 7-day trial period.
You will have to agree to EULA to be able to use the software. On the second page of the activation wizard you can check
how many days are left in the free trial period or enter the permanent license key. Note that internet connection is required
for permanent license activation. Once license is activated the software can be used without internet connection.
A single license key is good for a single user on a single computer activation.