Diversity Genie
Diversity Genie
Diversity Genie™ is a powerful tool to analyze datasets of small organic molecules.
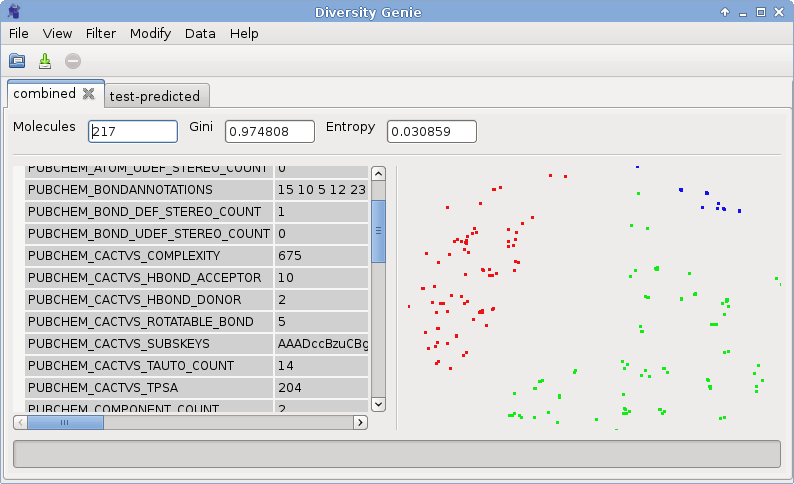
Diversity Genie visualizes molecular sets as a Sammon map. The first slide above demonstrates a combined set of Fluoroquinolones, Cephalosporins, and Penicillins. Each subset has been colored according to its origin. It is easy to observe different structural motifs clearly separated on the molecular map. Diversity Genie also allows a fast calculation and comparison of diversity of chemical sets.
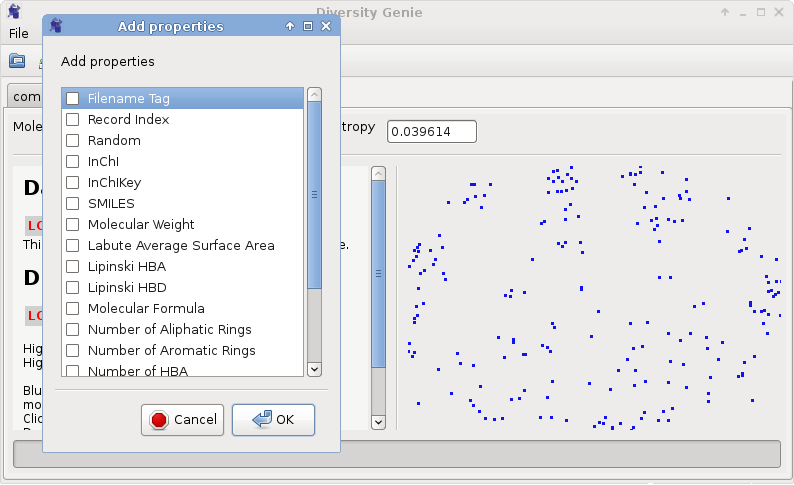
Diversity Genie offers multiple methods to organize your chemical data. With its ability to handle sets of millions of molecules it can sort, slice, and merge large SD files as well as interconvert between SMILES, InChI, and SDF formats. It offers easy to use filtering based on property values and structural uniqueness, computation of 2D and 3D atomic coordinates, addition/removal of implicit hydrogens, and computation of molecular properties such as molecular weight, number of rotatable bonds, number of HBO, HBA, as well as other descriptors. Properties can be exported and imported from CSV files and merged into molecular data.
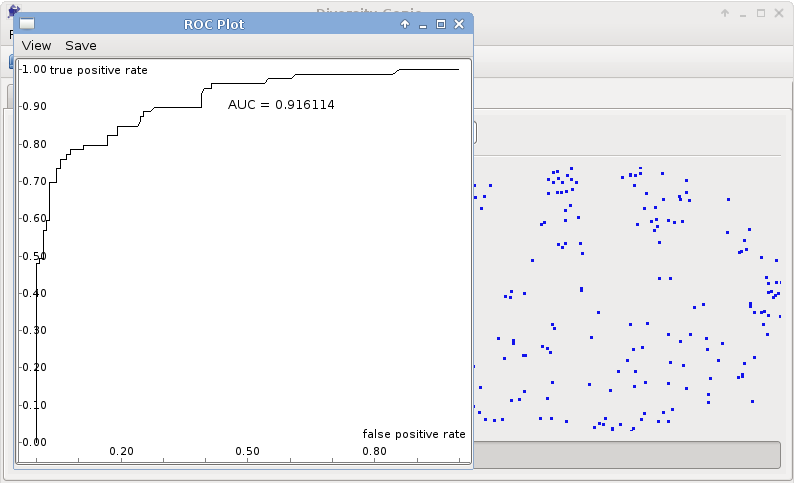
Graphing capabilities include making plots such as ROC, property histograms, and property-vs.-property. Area Under the Curve, the mean value, and Pearson correlation coefficient are automatically computed. You can also train SAR and QSAR models using powerful gradient boosting algorithms.